Greenheads
Identity and packaging design for matcha teas


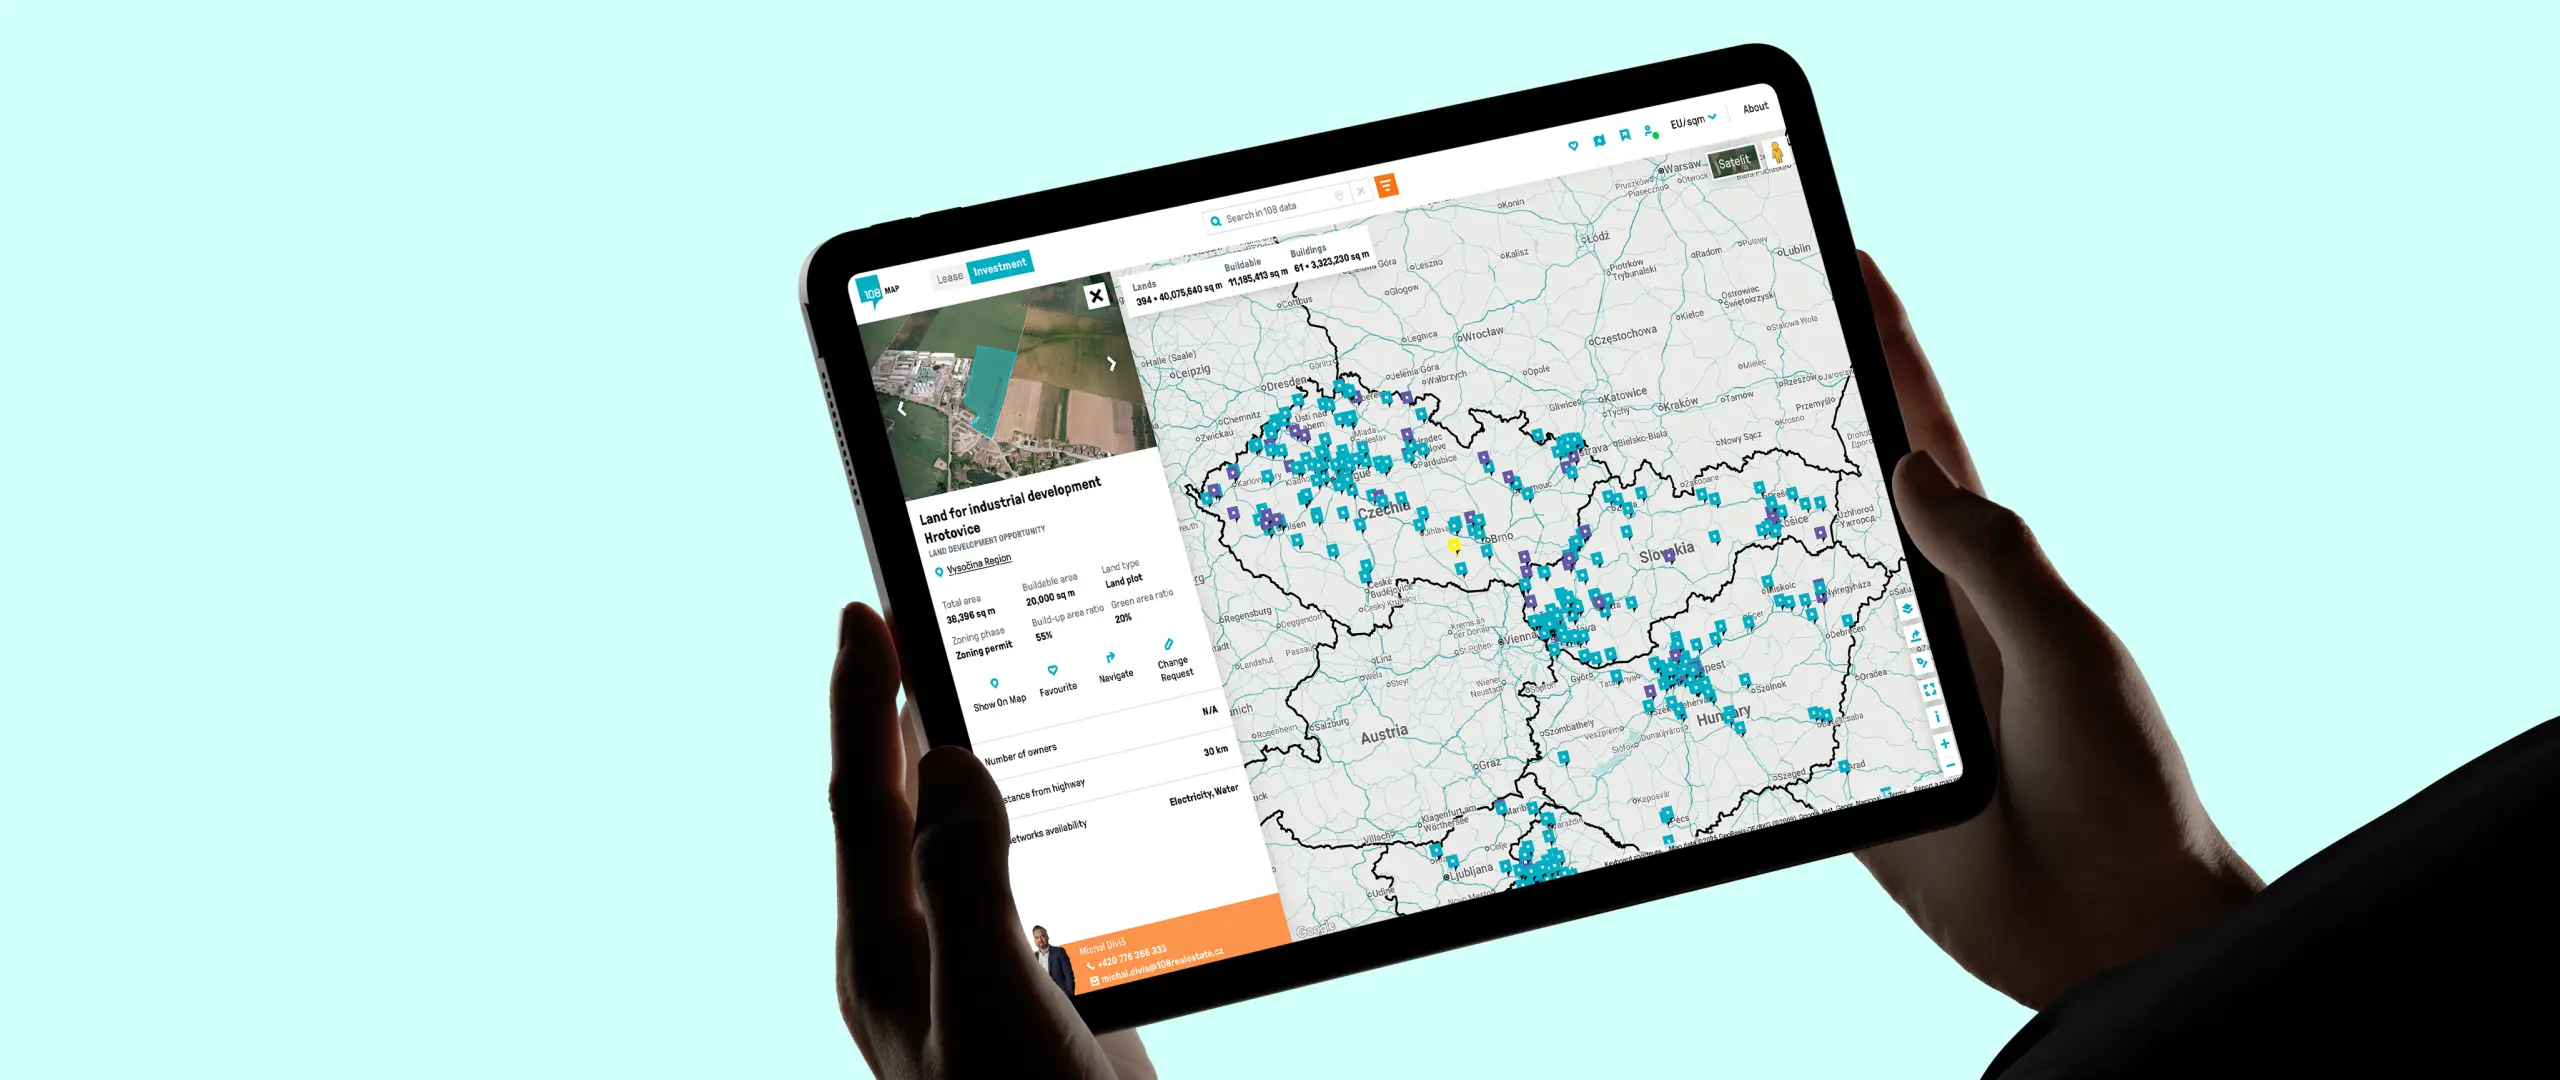

108 REAL ESTATE holds a massive amount of market data, but their flagship tool, 108 Map, was hitting usability limits. The original version was rich in information but cluttered and visually outdated for the user. We needed to transform a robust dataset into a tool that wasn't just a number warehouse, but a functional partner for business. The goal wasn't just to "repaint" the map, but to create an environment where users can instantly orient themselves and find exactly what they need to make investment or leasing decisions.
We didn't start by drawing; we started by talking. In an initial workshop with the 108 REAL ESTATE team, we deconstructed the previous solution and defined exactly what was frustrating for both clients and brokers. We realized that a "one-size-fits-all" view doesn't work. What an experienced analyst needs to see would overwhelm a regular customer. Therefore, we designed comprehensive user journeys separately for different roles. We validated needs based on real experience and built the architecture to make logical sense. This ensured that the technology adapted to the business, not the other way around.
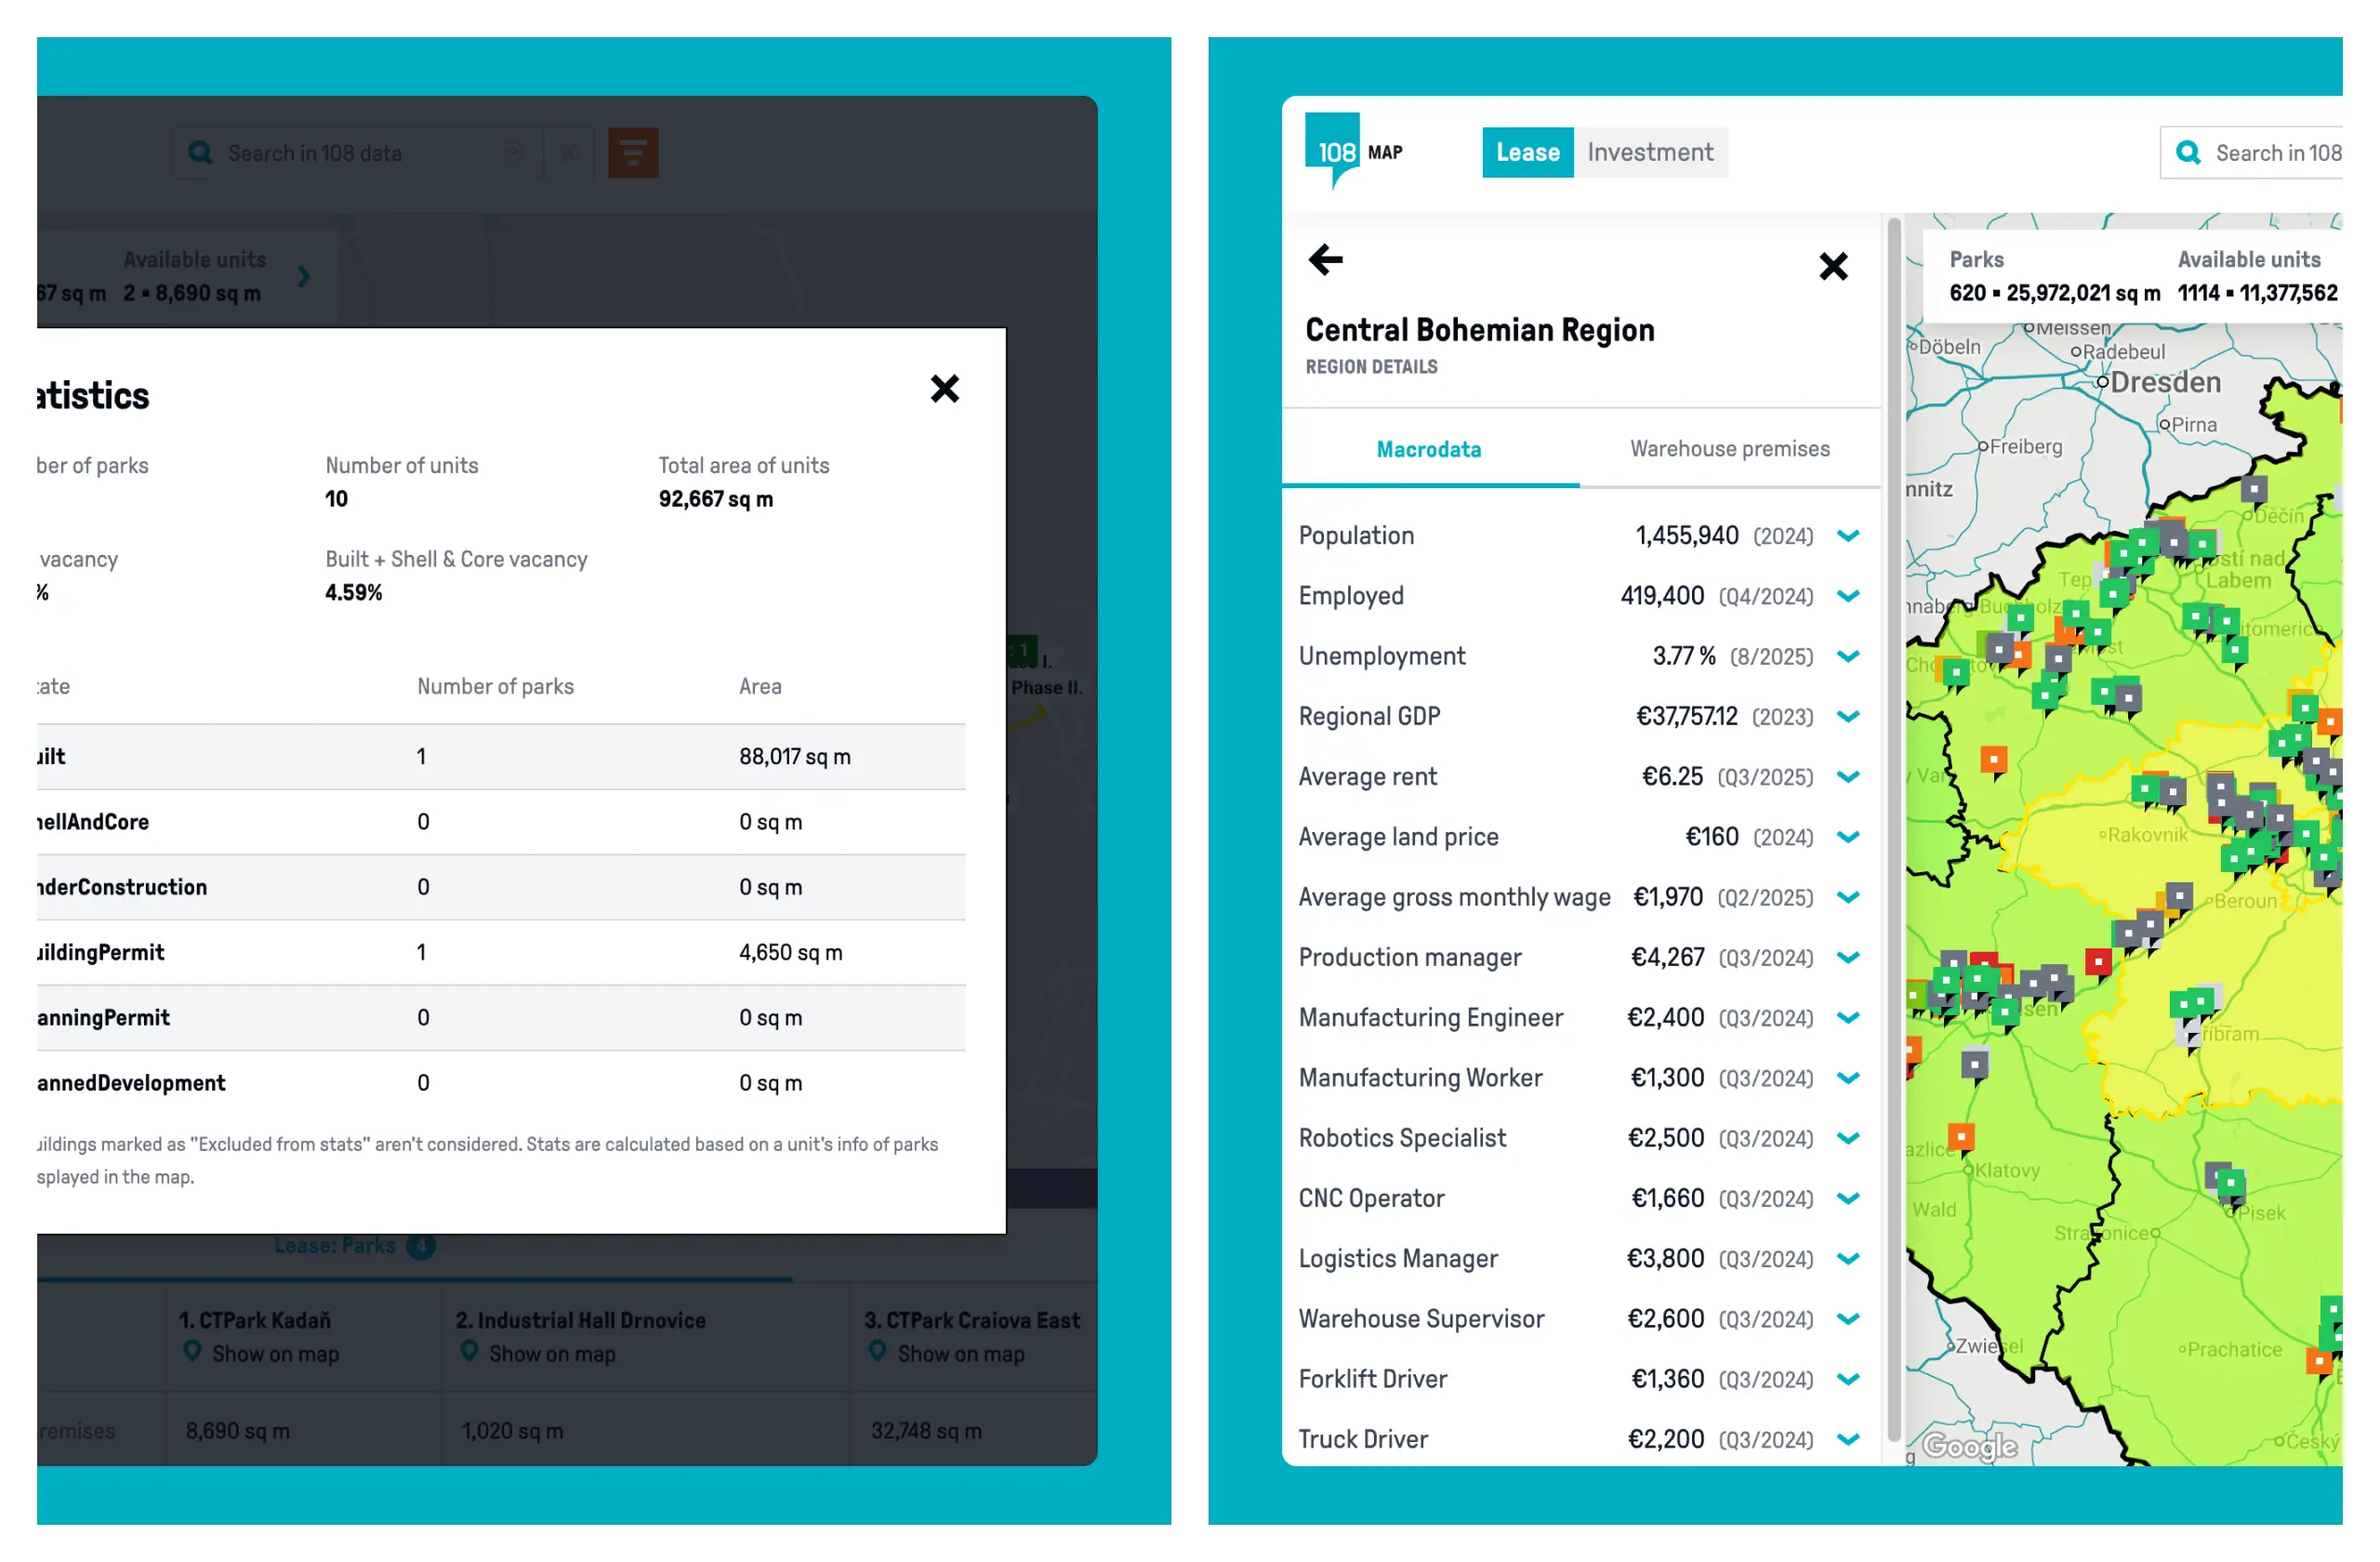
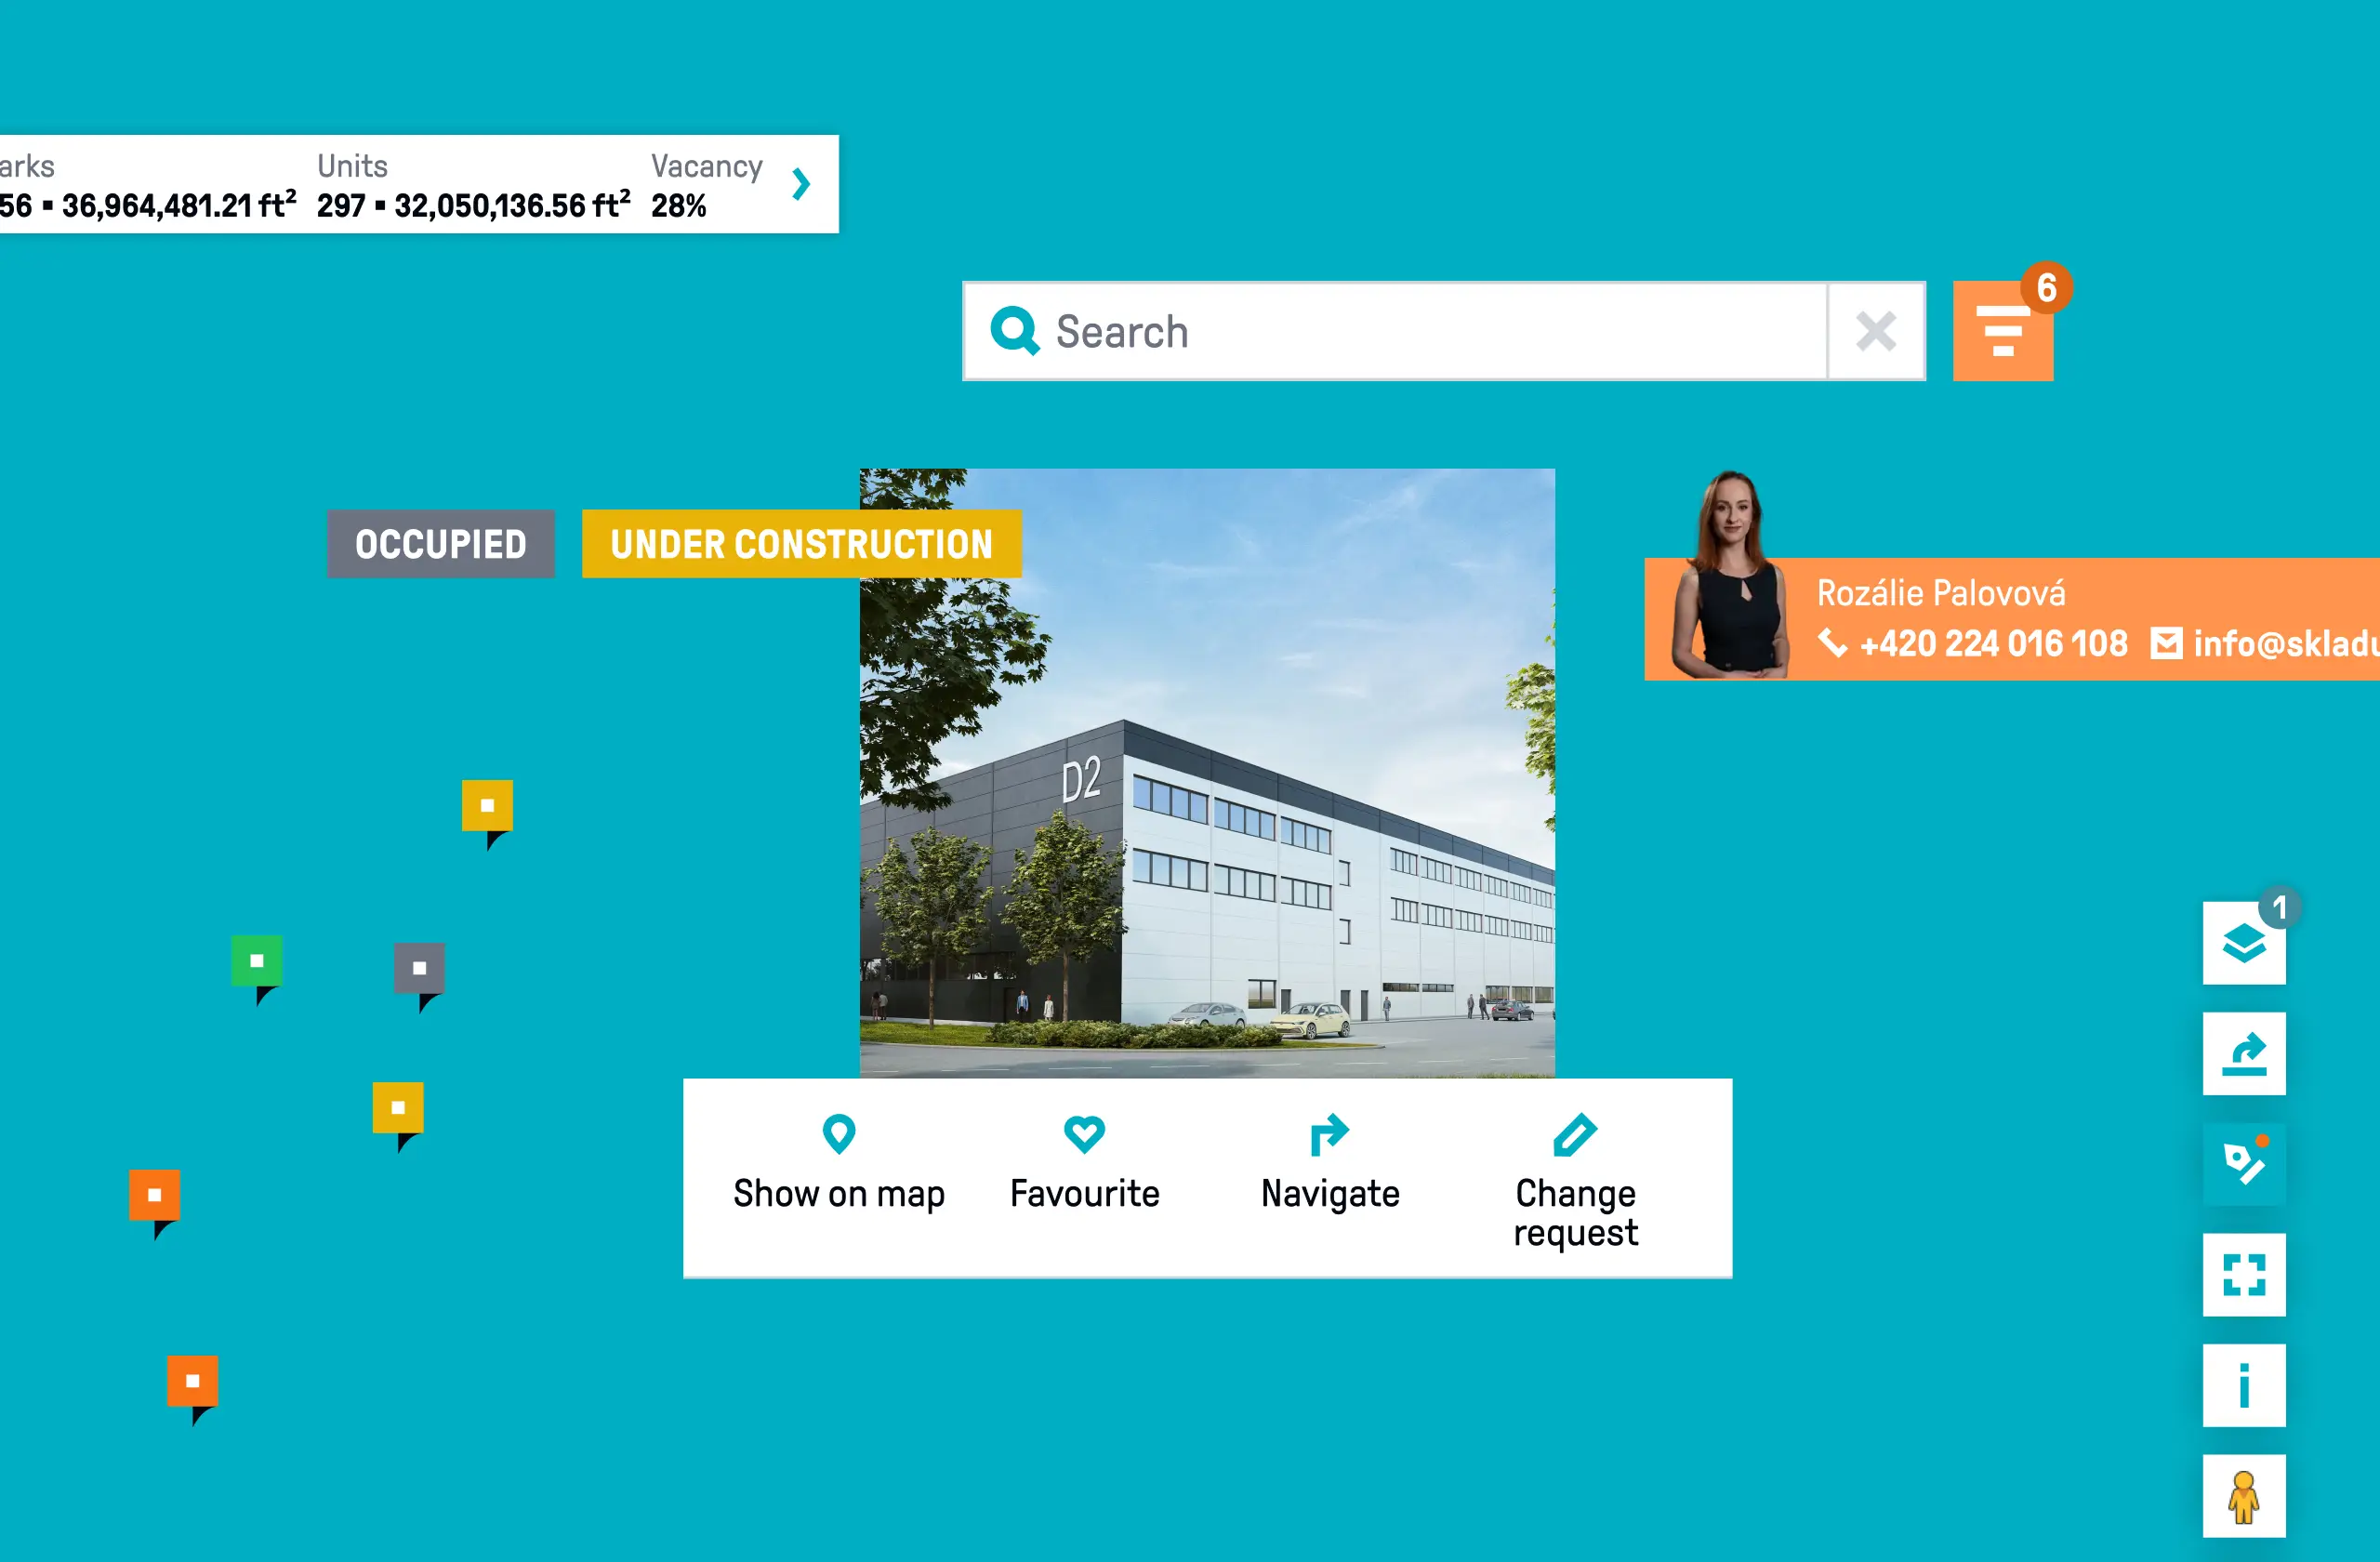
The result is an advanced analytical tool that serves complex data in a human-readable form. We implemented features to display key infrastructure and "rich data" layers, such as regional GDP, unemployment rates, and average wages. Users can now define their own zones using polygons or radius tools to search only within selected areas, drastically speeding up location workflows. For customers, we prepared a lightweight, clean view for easy orientation, while the internal team has a full set of filters at their disposal. We wrapped it all in a custom map style that respects the 108 REAL ESTATE visual identity and builds brand credibility.